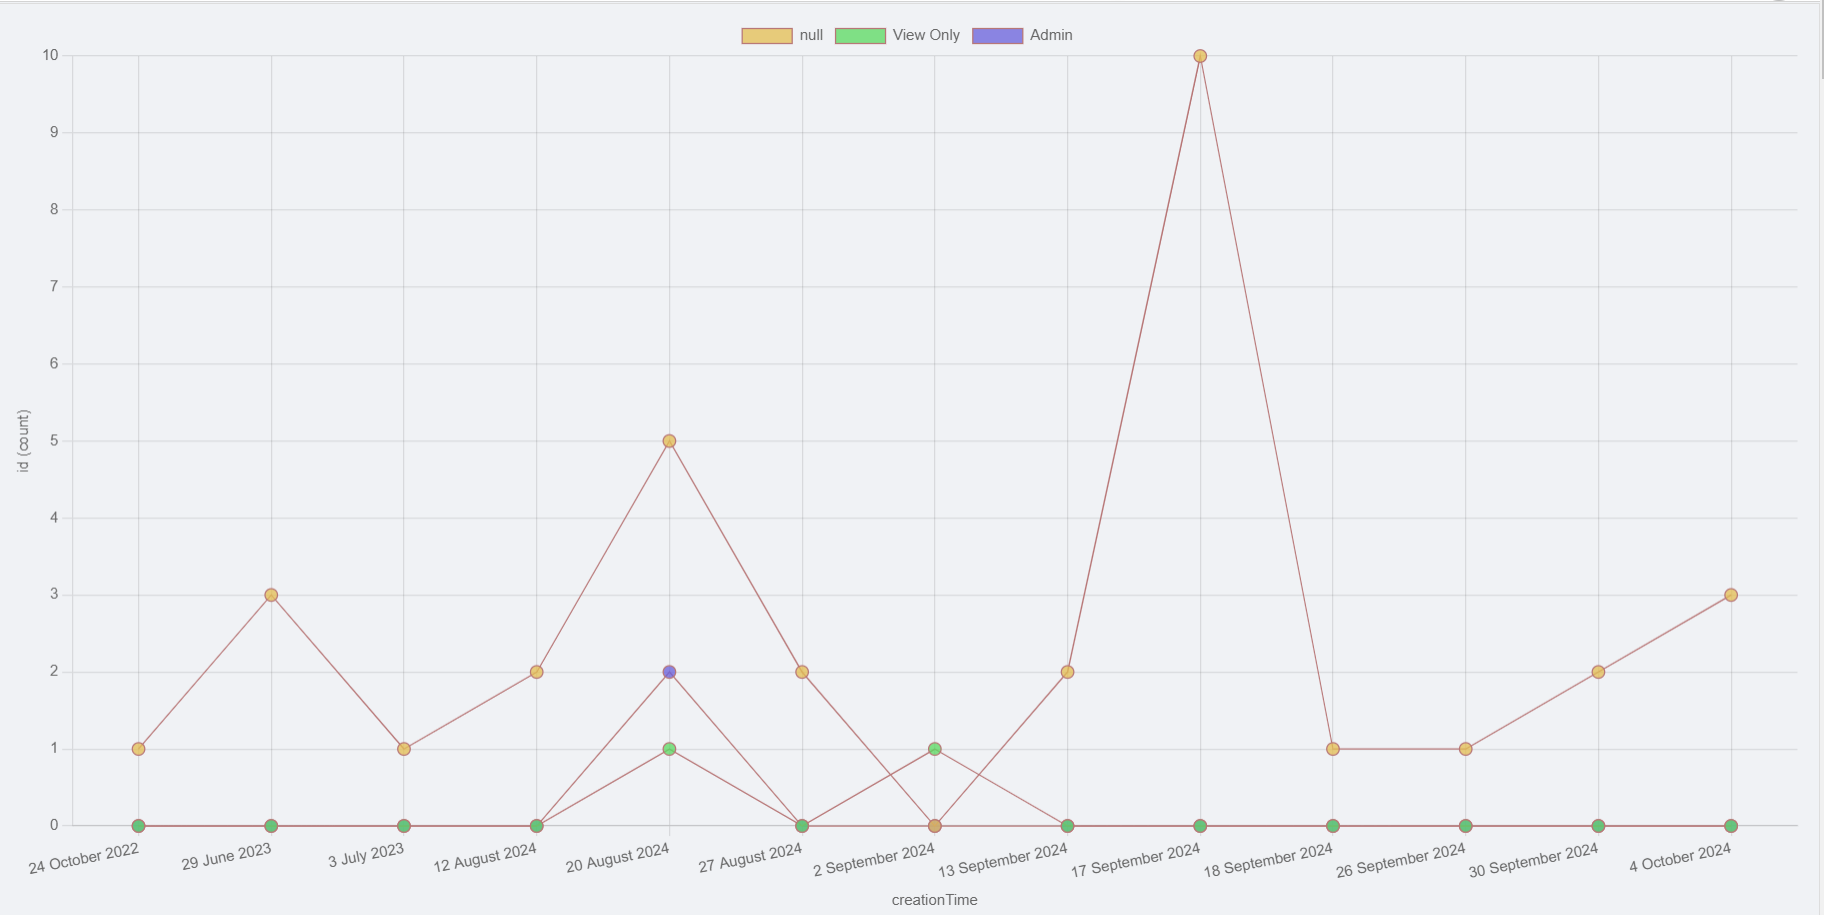
Chart
The Chart component allows for quick and easy creation of charts. It allows you to visualize data using bar, line, pie, or polar charts. Dynamic and shesha-native, the component can be used to display data from an Entity in your database or from a backend service, provided with an endpoint.

Properties
The following properties are available to configure the behavior of the component from the form editor (this is in addition to common properties).
Common
Property Name string
A unique identifier binding this chart to your form's data model. (Required)
Hide boolean
Toggle the visibility of the component.
Data
Data Source Type object
Choose where data comes from:
- Entity Type (default)
- URL
URL string
The endpoint to fetch chart data.
Entity Type string
Specifies which data entity to visualize.
Axis Property string
The field used on the x-axis.
Is Axis Property Time Series boolean
Toggle if x-axis is a time series.
Value Property string
The field used on the y-axis.
Legend Property string
For pivot charts, the grouping field.
Order By string
Sort records by this field.
Allow Chart Filter boolean
Toggle user-driven filtering directly on the chart.
Aggregation Method object
How values are aggregated:
- Sum
- Count (default)
- Average
- Min
- Max
Appearance
Width / Height number
Define chart dimensions in pixels.
Show Border boolean
Toggles border around the chart.
Chart Type object
Select the chart style:
- Line (default)
- Bar
- Pie
- Polar Area
Simple / Pivot object
Use Simple or Pivot mode:
- Simple (default)
- Pivot
Show Title boolean
Display the chart title.
Show Legend boolean
Toggles chart legend display.
Show X Axis / Y Axis boolean
Toggle visibility of axes.
Stroke Width number
Customize width stroke of elements.
Stroke Color object
Customize color stroke of elements.