Debug Panel
Shesha actually has two different debug panels for inspecting live data while you build or run a form: a read-only one built into the Form Designer, and a separate, editable one available anywhere in a running application. They are opened differently and show different things - this page covers both.
Form Designer Debug Panel
Toggled with the bug-icon Debug button in the Form Designer toolbar. It renders inline inside the designer canvas, below the form, as a read-only JSON dump: the current Form data, followed by one collapsible panel per active context (for example formContext, pageContext, or a Data Context on the form), each showing that context's raw data.
App-Wide Debug Panel
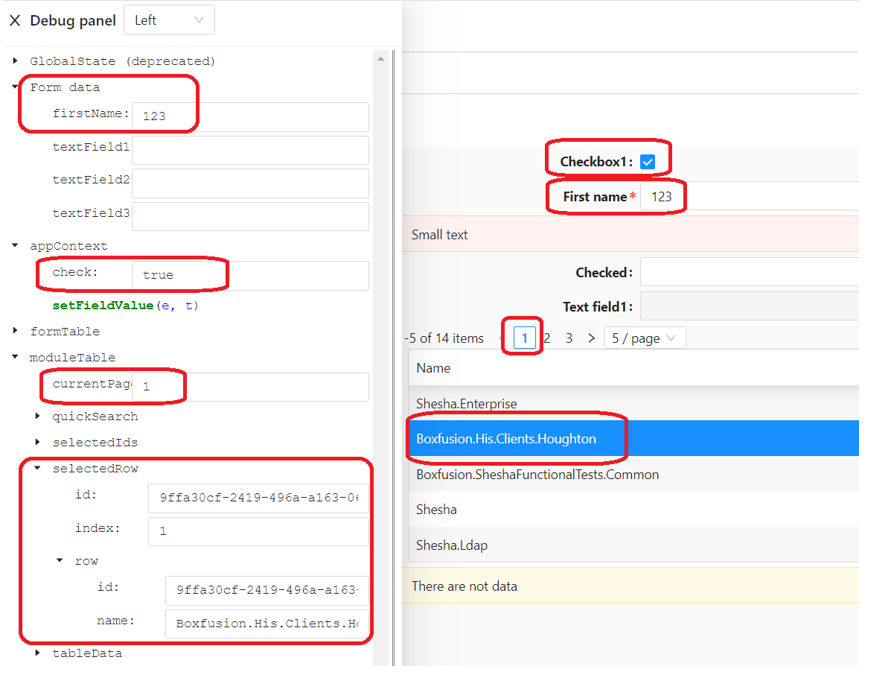
Opened with Ctrl+F12 from anywhere in a running application, not only the Form Designer, or by wiring a button to the built-in Toggle debug panel configurable action. It opens as a floating, resizable panel that can be docked to the Top, Bottom, Left, or Right of the screen (it remembers your last position and size).
Unlike the Form Designer's version, this panel shows three things as expandable, editable trees rather than plain JSON:
- GlobalState - labelled "GlobalState (obsolete)" in the panel itself, so avoid relying on it for new work.
- Form data - the current page's form data.
- One entry per active context (for example
appContext,pageContext,formContext,webStorage, or a Data Context on the form).
Because the trees are editable, changing a value in this panel writes it straight back into the running form or context, exactly as if a user had entered it. Use it for testing and diagnostics, not in front of end users.
Usage
Reach for the Debug Panel whenever you need to see what a script, component, or the form itself would actually see, instead of scattering console.log calls through your code or guessing at a context's shape:
- Check what fields and values are actually present in
dataat a given point, especially on entities with many properties. - Confirm a context (
pageContext,formContext, an entity Data Context, and so on) exists and holds what you expect before writing a script against it. - Reproduce an edge case at runtime by editing a value directly in the Ctrl+F12 panel, rather than re-entering it through the UI every time.
- Verify that a scripted Hide/Visibility expression or event handler is reading the field you think it's reading.
Benefits
- No temporary logging - inspect live state directly instead of adding and later removing
console.logstatements. - Faster iteration when testing - the app-wide panel lets you edit form data, global state, and context values directly, so you can try different inputs without re-entering them through the UI each time.
- One tool for both design-time and runtime state - the Form Designer panel and the Ctrl+F12 panel between them cover what a form's data and contexts look like whether you're building the form or running it.